

Value
generation
We contribute towards the generation
of wealth and progress of society
Economic
sphere
€97.2 million
Taxes paid
€700 million
Ecomonic value distributed
Social
sphere
€334.4 million
Payments to employees
€4.9 million
Invested in social welfare programs
and in sustainable agriculture
Environmental
sphere
€4.3 million
Environmental investment
31,025 Tm Co2e
Emissions avoided into the atmosphere
Ebro
worldwide


Average headcount
employees

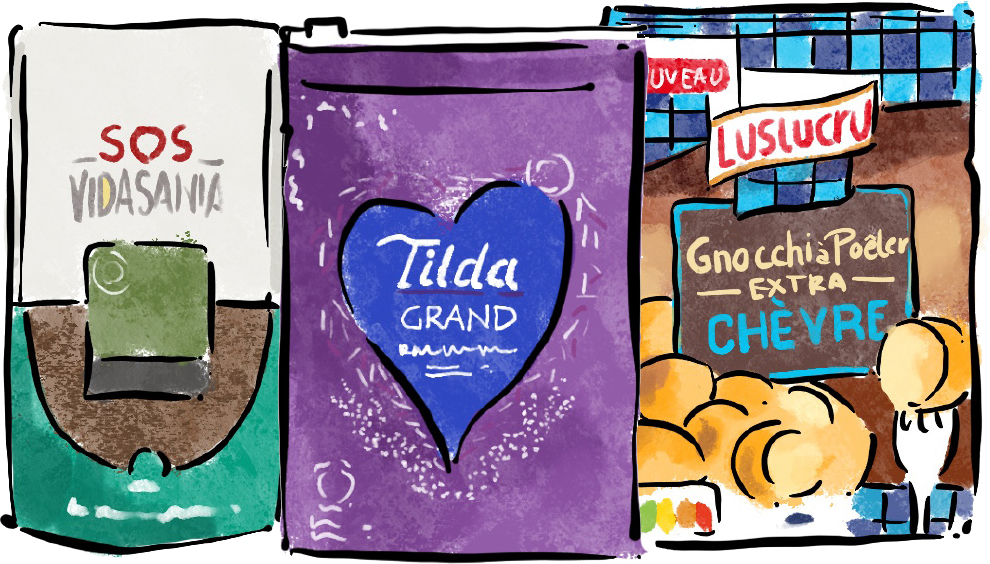
Brands
Facilities
- 57 Plants
- 11 Warehouses
- 10 Offices
Average headcount
employees
Facilities
Brands
Average headcount
employees
Facilities
Brands
industrial presence
comercial presence
- Austria
- Belgium
- Czech Republic
- Denmark
- Estonia
- Finland
- France
- Germany
- Greece
- Hungary
- Iceland
- Ireland
- Italy
- Lithuania
- Netherlands
- Portugal
- Romania
- Sweden
- Switzerland
- Tunisia
- UK
Average headcount
employees
Facilities
Brands
industrial presence
comercial presence
- Algeria
- Angola
- Egypt
- Ghana
- Libya
- Morocco
- Mozambique
- South Africa
Average headcount
employees
Facilities
Brands
industrial presence
comercial presence
- Bahrain
- Israel
- Jordan
- Kuwait
- Lebanon
- Oman
- Qatar
- Saudi Arabia
- United Arab Emirates
- Yemen
- Cambodia
- India
- Japan
- Thailand
Average headcount
employees
Facilities
Brands
industrial presence
comercial presence
- Canada
- EEUU
Average headcount
employees
Facilities
industrial presence
comercial presence
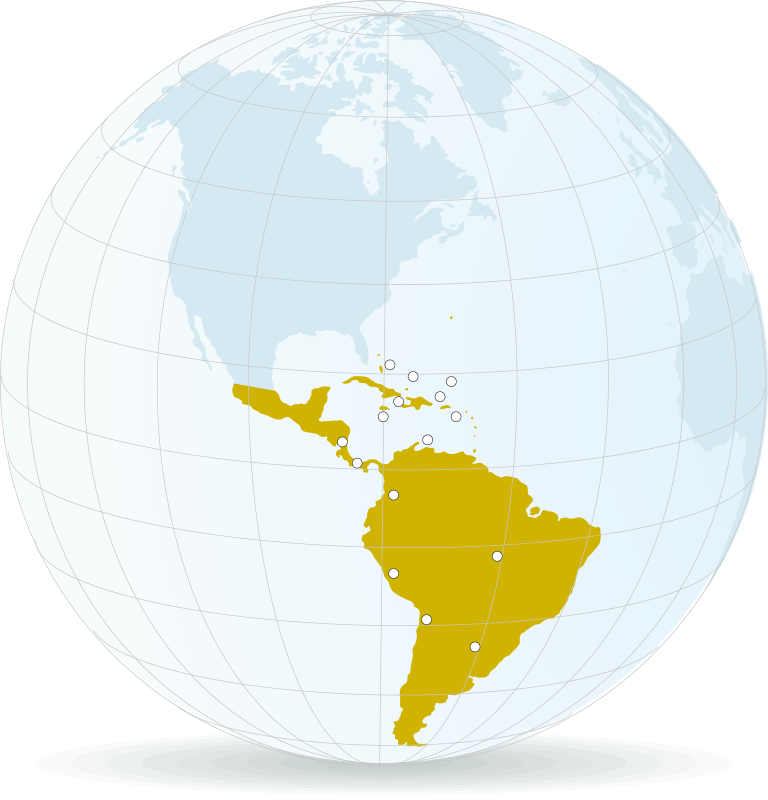
- Argentina
- Bahamas
- Bermuda
- Brazil
- Chile
- Colombia
- Costa Rica
- Curaçao
- Haiti
- Jamaica
- Panama
- Peru
- Puerto Rico
- San Martin
- US Virgin Islands
Consolidated
Group
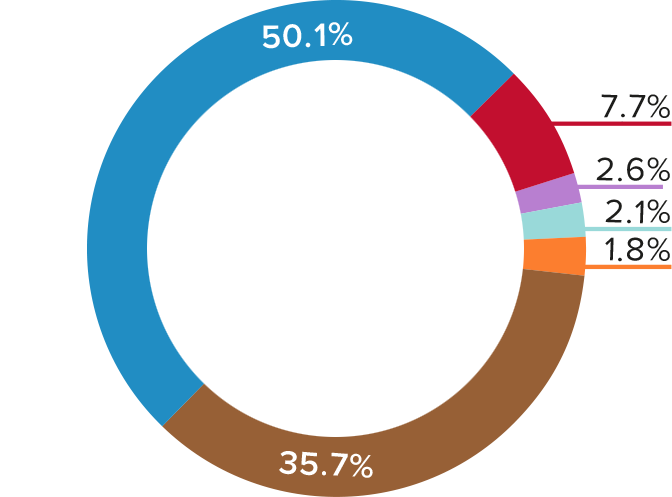
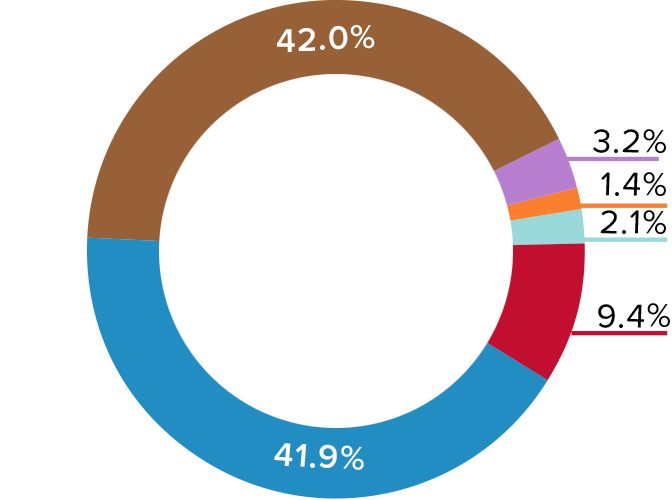
Sales by geographical areas
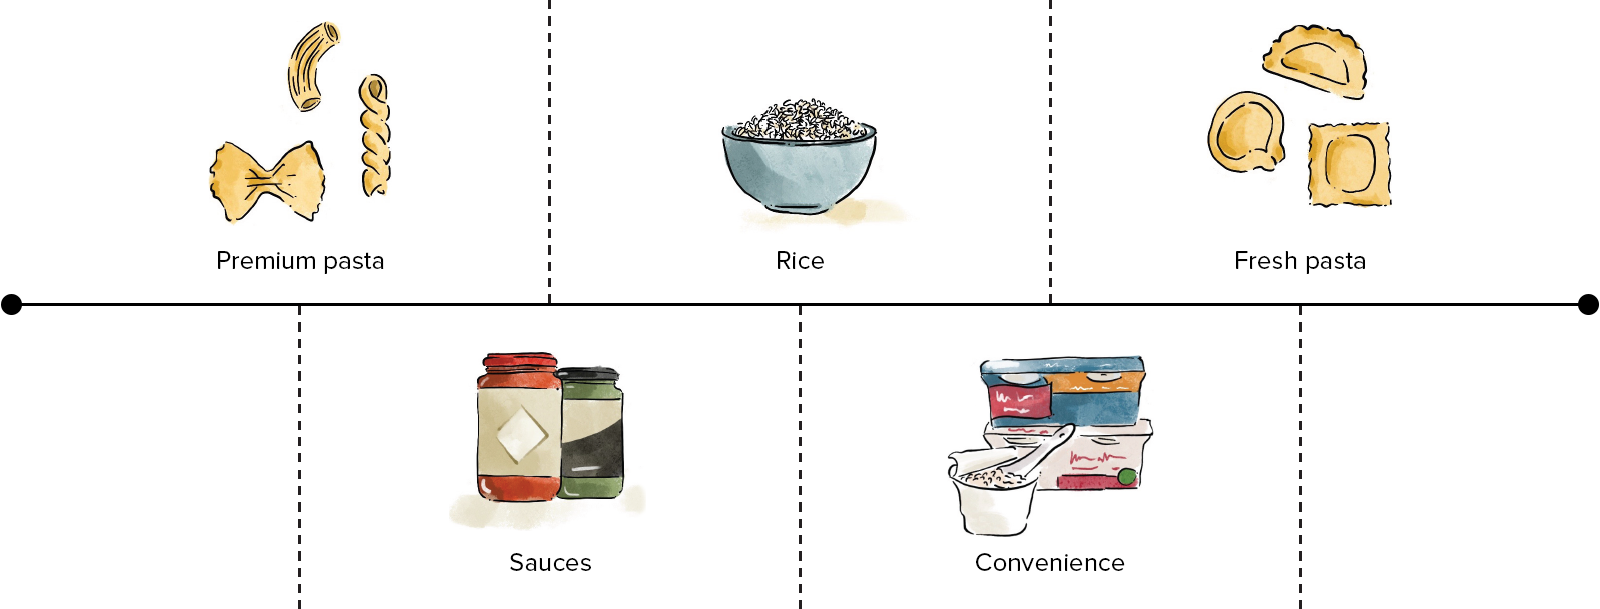
Sales by business areas
EBITDA-A by business areas
Rice
Area
Average headcount employees
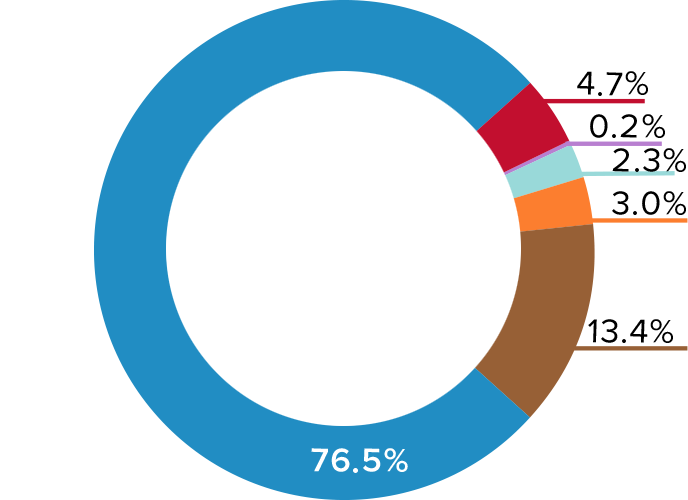
Sales by geographical areas
Pasta
Area
Average headcount employees
Sales by geographical areas
CSR in Ebro
OUR TEAM
6,414
Total Average headcount employees
€2.06 million
Investment in occupational risk prevention
136,230 hours
Staff training
92.09%
Staff with indefinite contracts
EBRO AND SOCIETY
683,825 kilos
Food donated
72
Social initiatives
€4.9 million
Investment in social programs
OUR SHAREHOLDERS
€88 million
Dividends paid to shareholders
3.9%
Dividend yield per share
OUR PUBLIC
198
Certifications in Quality and Food Safety
€19.3 million
Expenditure and investment in R+D+i
159
Products in the Healthy category
64
New product launches
EBRO AND THE ENVIRONMENT
![]() 34%
34%
Self-generated energy (photovoltaic and cogeneration)
![]() 28%
28%
Energy intensity (GJ/M€ net sales)
![]() 30%
30%
Water consumption in production
62%
Recovered waste
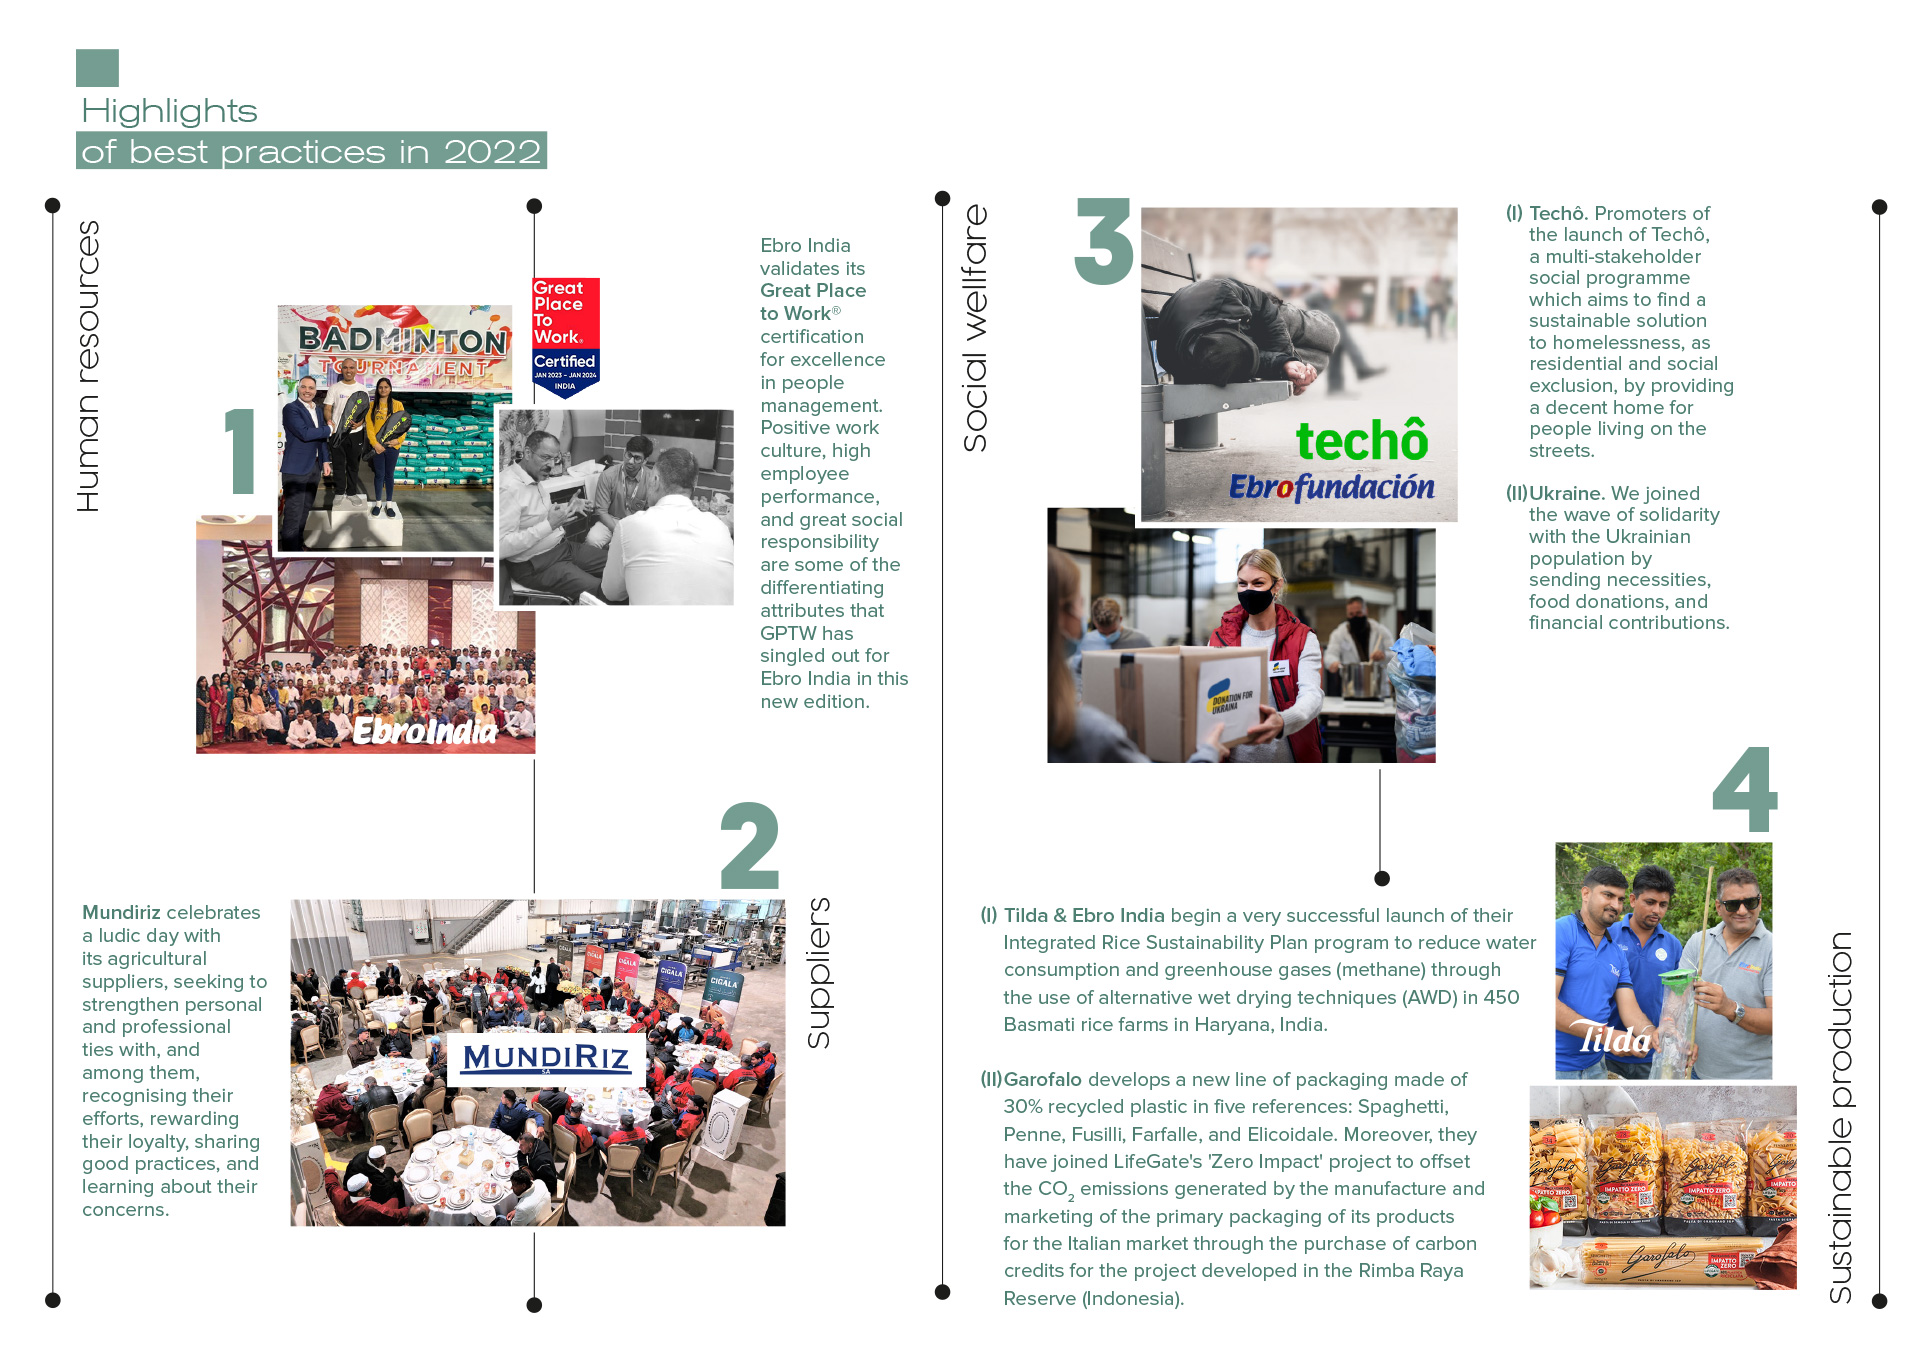
BEST PRACTICES
IN 2022